In the world of digital analytics, one common question arises: should a brand allocate more resources to attracting new customers or nurturing existing ones? While existing customers are invaluable, focusing marketing spend on acquiring new customers often yields more significant long-term growth. Targeting new customers is essential for expanding reach, diversifying revenue sources, and maintaining brand relevance.
This blog delves into the fundamentals of traffic sustainability analysis, along with retention and engagement metrics. By understanding how users interact with your website and making data-driven decisions, you can drive sustainable growth in both customer acquisition and retention. Whether you’re a beginner or just looking to refine your approach, this guide will equip you with insights to help make informed choices that impact your business’s bottom line.
To build a sustainable digital presence, it’s essential to analyze key user metrics. Let’s explore how tracking metrics like user retention, engagement, and cohort analysis can provide actionable insights into both acquiring new customers and keeping them engaged.
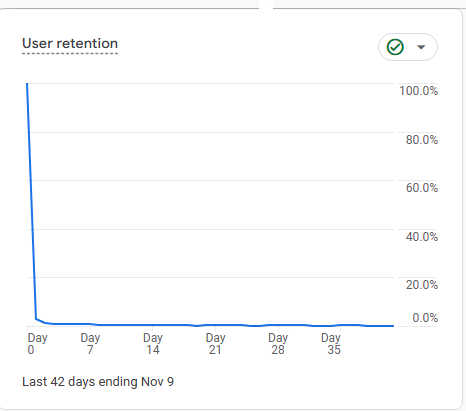
Chart Explanation: This retention chart shows the percentage of users retained over a 42-day period. The sharp drop from Day 0 to Day 7, followed by a relatively flat line, suggests that most users drop off quickly and do not return after their initial visit.
Insight: This could indicate that users are not finding lasting value in your site or service, which is common for content-driven or transactional sites where users complete a task and leave.
Mathematics Behind It: Retention rate is calculated as:
Retention Rate = ( Number of Returning Users / Total users in cohort ) × 100
For instance, if 100 users visited on Day 0 and only 10 returned by Day 7, the retention rate for Day 7 is 10%.
Next Steps: Improving retention often involves enhancing user experience, creating engaging content, or implementing loyalty incentives to encourage users to return. Experiment with changes and track if the retention curve shifts upward over time.
2. User Engagement
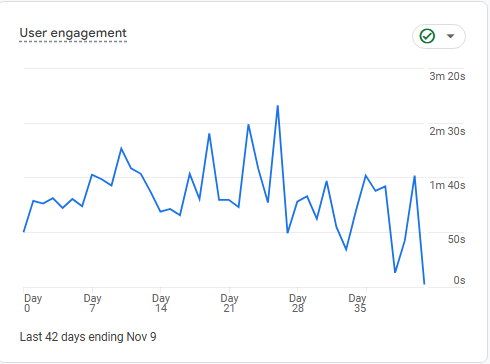
Chart Explanation: This line chart shows fluctuations in user engagement over time, measured in terms of time spent on the site or specific actions taken. Peaks and troughs indicate days of high and low engagement, respectively.
Insight: Peaks may align with specific content releases, marketing efforts, or seasonal events. Troughs indicate periods of low engagement, which can help in identifying when user interest fades.
Mathematics Behind It: Average engagement time could be calculated as:
Average Engagement Time = ( Total Time Spent by All Users / Number of Users ) × 100
Next Steps: To boost engagement, analyze what caused the peaks and try to replicate these conditions. If certain content or campaigns perform well, focus on similar strategies to maintain consistent engagement.
3. User Retention by Cohort
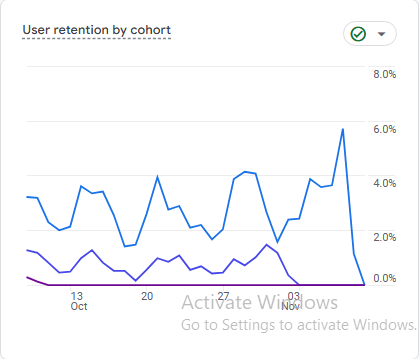
Chart Explanation: This chart segments user retention by different cohorts over time. Each line represents a group of users who first visited the site on a specific date, showing their retention patterns.
Insight: If certain cohorts have higher retention rates, analyze what made that time period unique. A consistently low retention across cohorts might indicate a need for site improvements.
Mathematics Behind It: This is similar to the standard retention rate calculation, but here it’s applied to specific cohorts:
Cohort Retention Rate = ( Returning Users in Cohort / Users in cohort on Day 0 ) × 100
Next Steps: Identify any high-retention cohorts and determine if specific strategies during that period contributed to their loyalty. Use these findings to tailor future marketing and engagement efforts.
4. User Engagement by Cohort
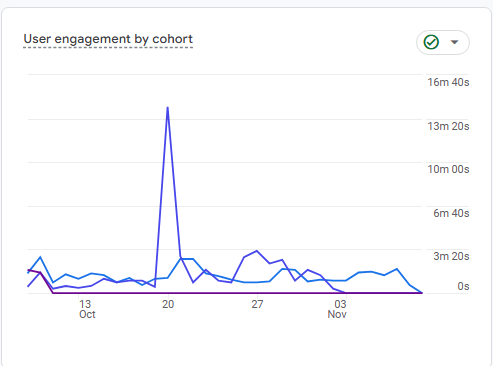
Chart Explanation: Similar to the retention cohort chart, this shows engagement by cohorts over time. Peaks in engagement for specific cohorts can reveal successful periods for your site.Insight: Sharp peaks in engagement might be related to special events, content releases, or promotions. This information is useful for planning future campaigns.
Mathematics Behind It: Cohort engagement rate could be calculated as:
Cohort Engagement = ( Total Time or Actions by Cohort / Numbers of Users in cohort ) × 100
Next Steps: Look at what factors influenced the spikes in specific cohorts and leverage those tactics in future strategies. Consistent engagement across cohorts suggests effective ongoing value, whereas sporadic peaks might indicate occasional success that you could aim to make more consistent.
5. Average 120-Day Value
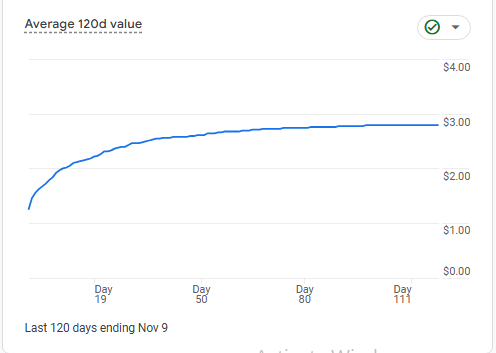
Chart Explanation: This chart shows the average value per user over a period of 120 days. The line graph starts with a steep rise and then begins to plateau. This generally indicates that users’ value (such as revenue, engagement, or other KPIs you’ve set) quickly increases initially and then stabilizes.
Insight: The steep rise at the beginning suggests that most value from users is generated early on, possibly within their first interactions with the site. The flattening curve shows that after a certain period, the rate of new value creation decreases, meaning users are not adding as much incremental value over time.
Mathematics Behind It: Each point on the graph represents an average value per user. If you’re tracking revenue, for example, you’d calculate it as:
Average Value = ( Total Revenue / Numbers of Users ) × 100
This helps in understanding the long-term value per user and determining if efforts should focus on acquiring new users or increasing retention of existing ones.
Next Steps: If the value plateaus early, consider strategies to re-engage users or provide additional offerings after their initial interactions to maintain growth.
To grow a sustainable digital presence, you need a balance between customer acquisition and retention. While it’s tempting to allocate resources solely to attracting new users, nurturing those relationships is equally vital for business longevity. Here’s how to put these insights into action:
In digital marketing, the debate between acquiring new customers and nurturing existing ones continues. But the most successful businesses recognize the importance of both. Acquiring new customers is essential for expanding reach, diversifying revenue sources, and maintaining brand relevance. At the same time, keeping users engaged and retained drives long-term value and brand loyalty.
Tracking key metrics like user retention, engagement, and cohort analysis equips you with actionable insights to build a sustainable business. These data-driven strategies empower you to make informed choices that enhance user experience, maximize marketing ROI, and ultimately drive growth.
Use this guide as a foundation to analyze your traffic sustainability and make decisions that balance the acquisition of new users with the engagement and retention of your existing ones. Small, data-backed changes in these areas can yield significant results, building both a loyal customer base and a strong, sustainable brand.
Do not want to miss any news, updates, notice or any offer on our products, then please subscribe to our mailing list.
Copyright by satyafinder.com 2024. All rights reserved.